nanoraw Documentation
nanoraw is a python package (with command line interface) used to analyze nanopore data. This tool primarily allows for the identification of modified DNA bases by comparing native and amplified DNA samples that have been processed by nanopore sequencing. See the nanoraw manuscript or more details on the proof of principle for the use of nanoraw to identify modified DNA bases (Pre-print manuscript).
Installation
Official nanoraw releases are available through the python package index (nanoraw package site)
Install the latest official release with pip: pip install nanoraw
Install the most recent development version with: pip install git+https://github.com/marcus1487/nanoraw.git
nanoraw commands are then available on the command line. For all options run nanoraw -h. Note that the python package rpy2 is required for any plotting functions (along the the R package ggplot2).
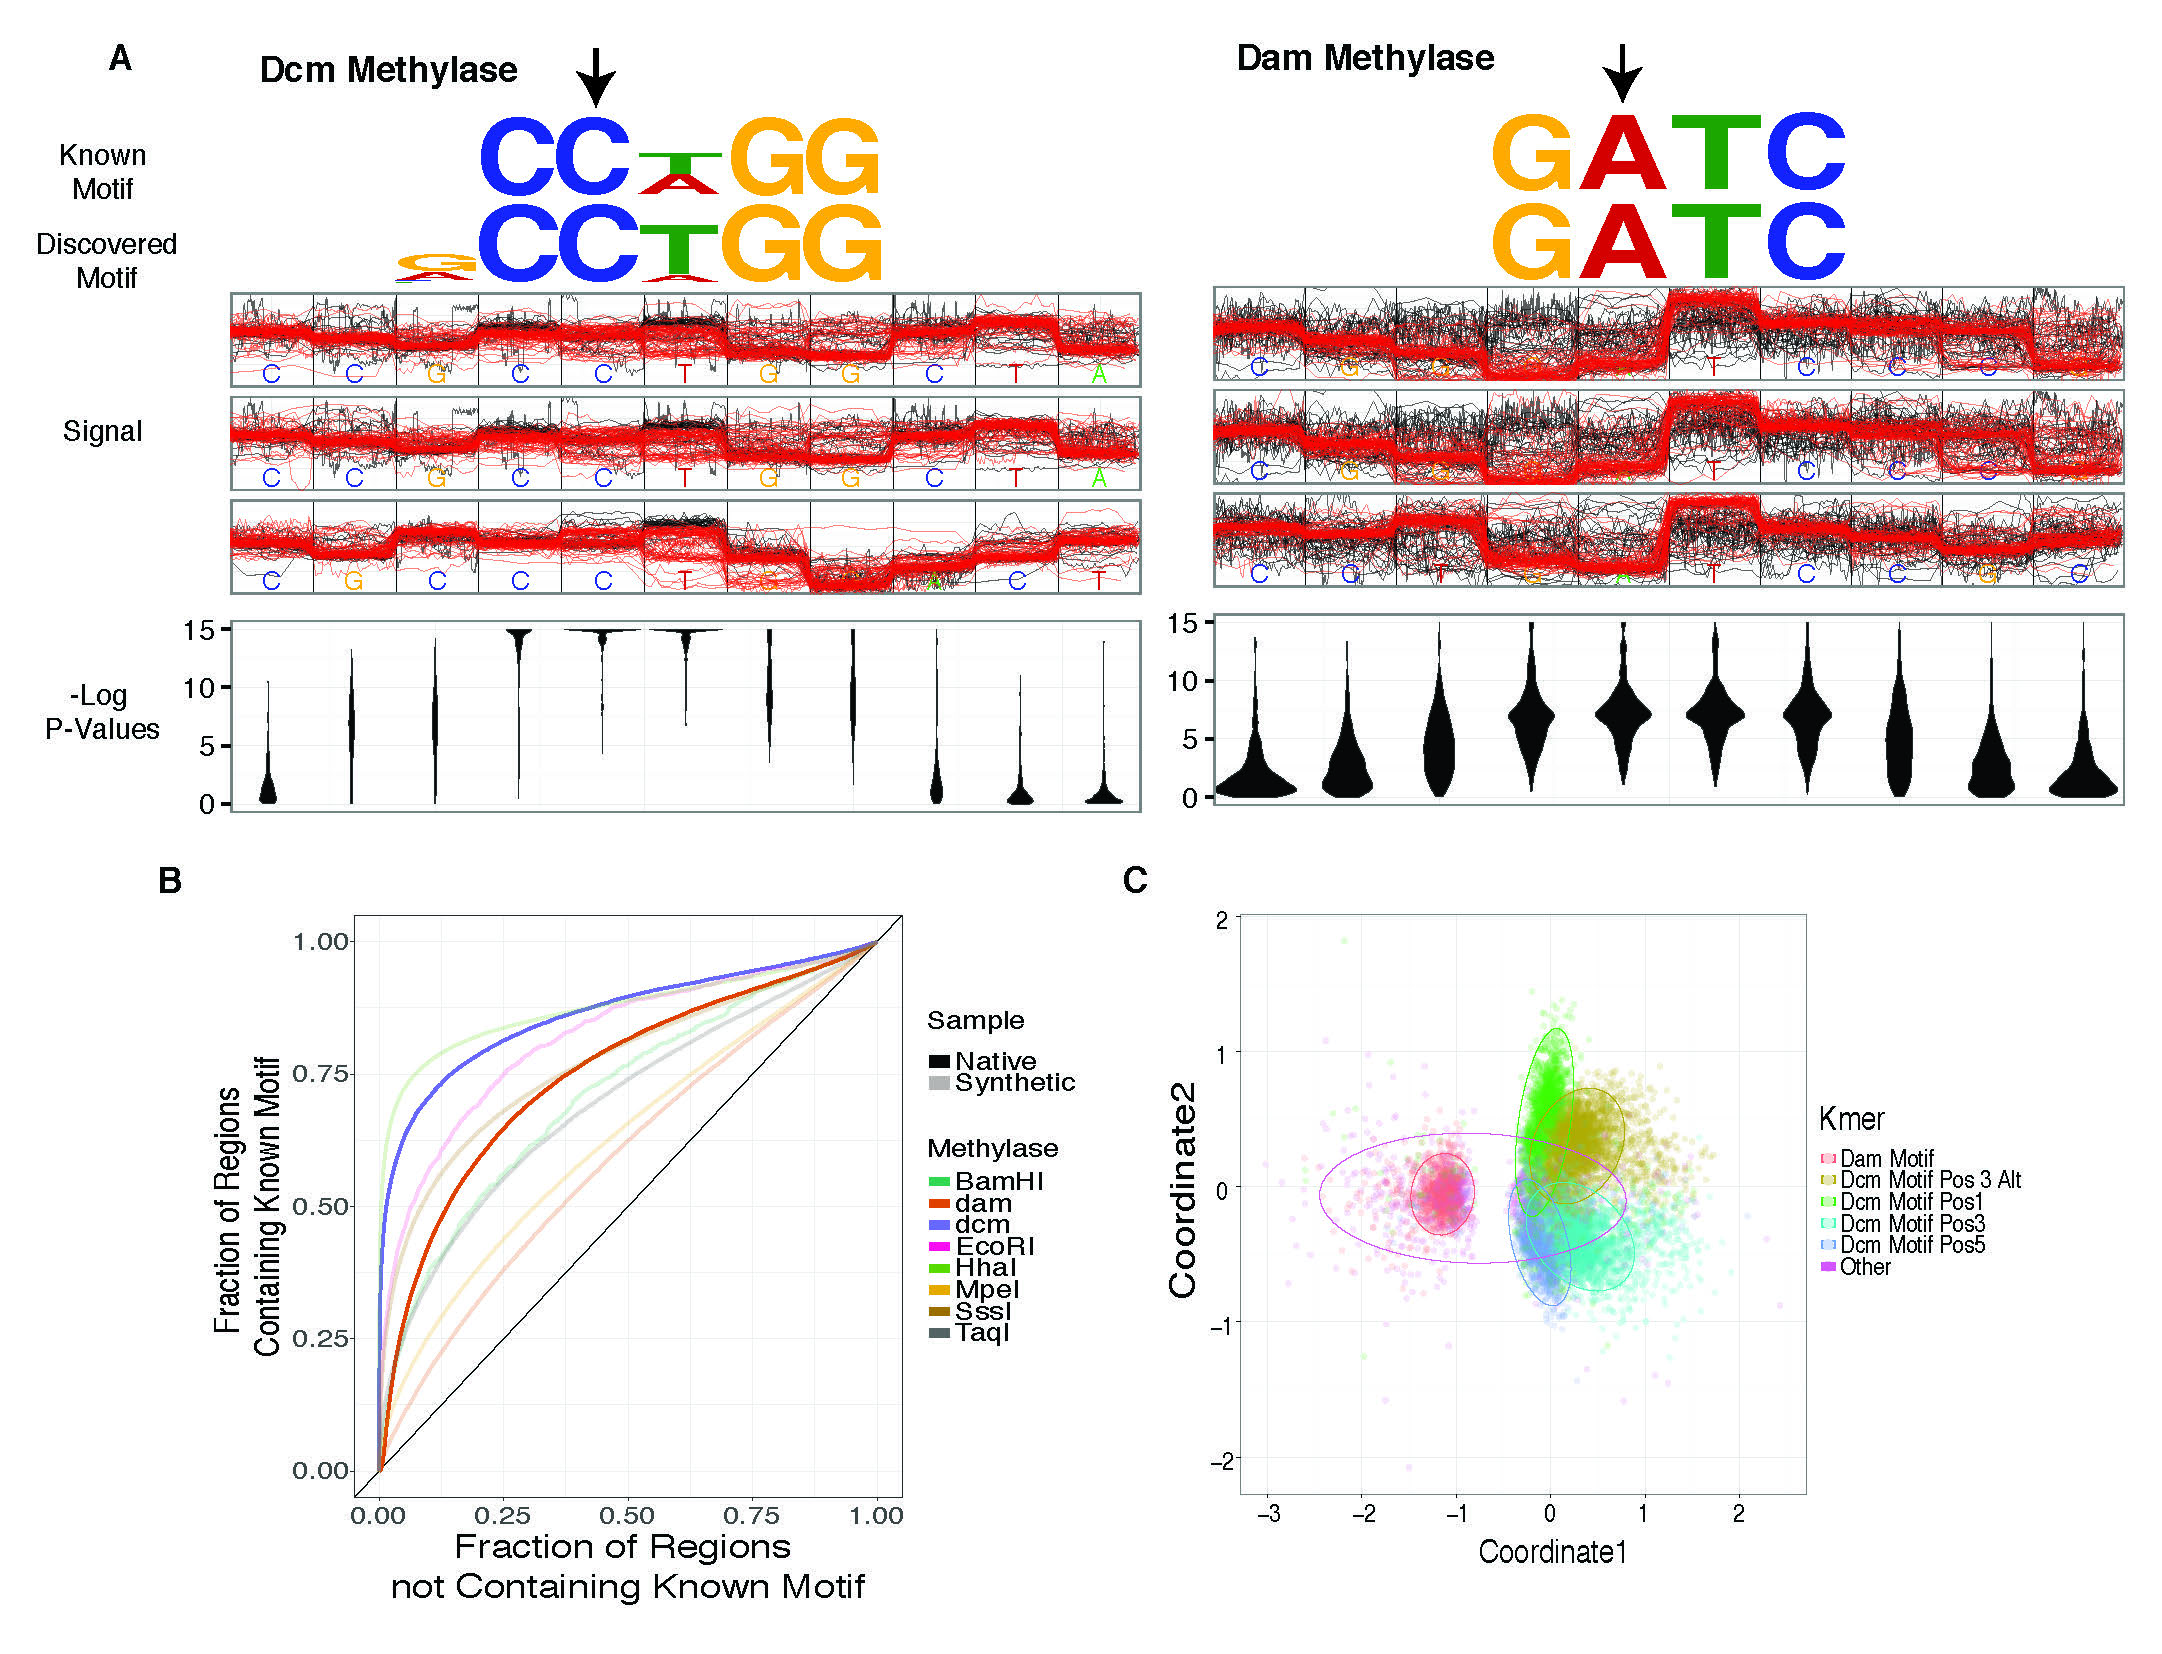
Detection of in vivo methylated bases, as well as detect capacity and clustering based on raw signal levels.
nanoraw allows for the visualization of raw nanopore signal (below) facilitated by resolving raw signal with a genomic alignment from error-prone basecalls.
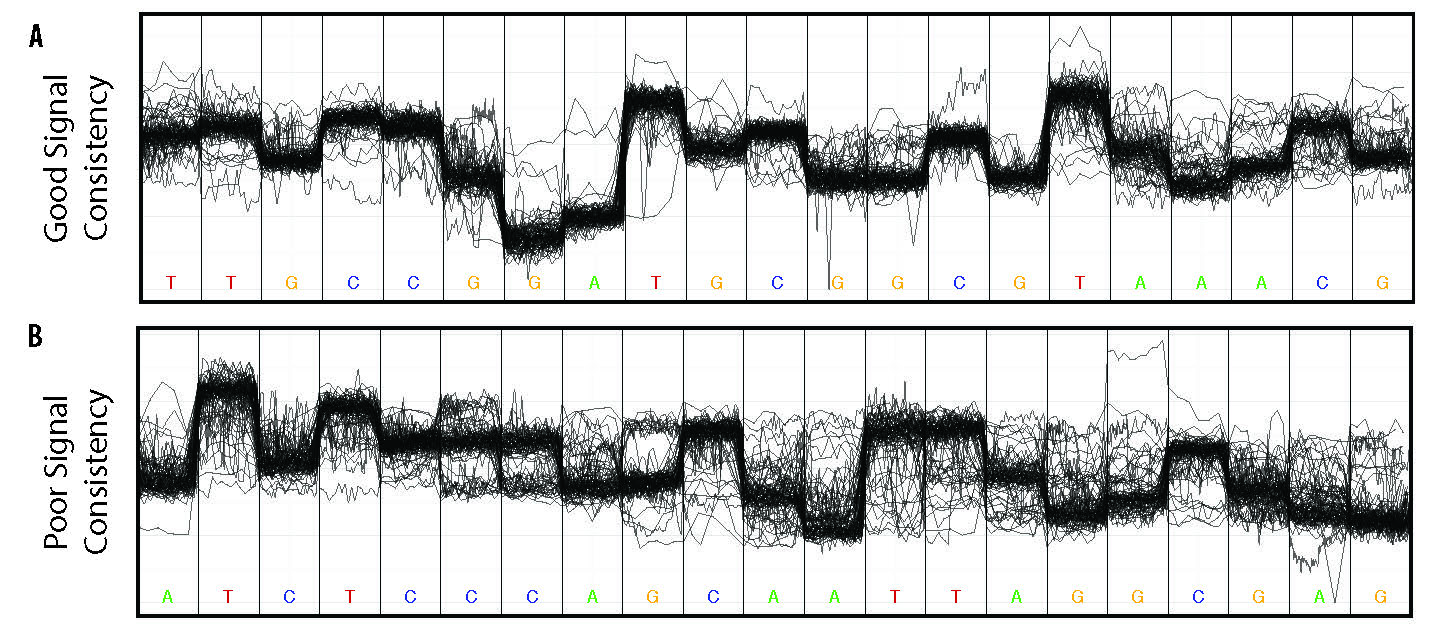
Example loci with good and poor signal correspondence.
The above plots as well as many others are described in the documentation here.
nanoraw produces genome wiggle files for a number of attributes related to nanopore data including significance p/q-values, mean signal levels, and many more.
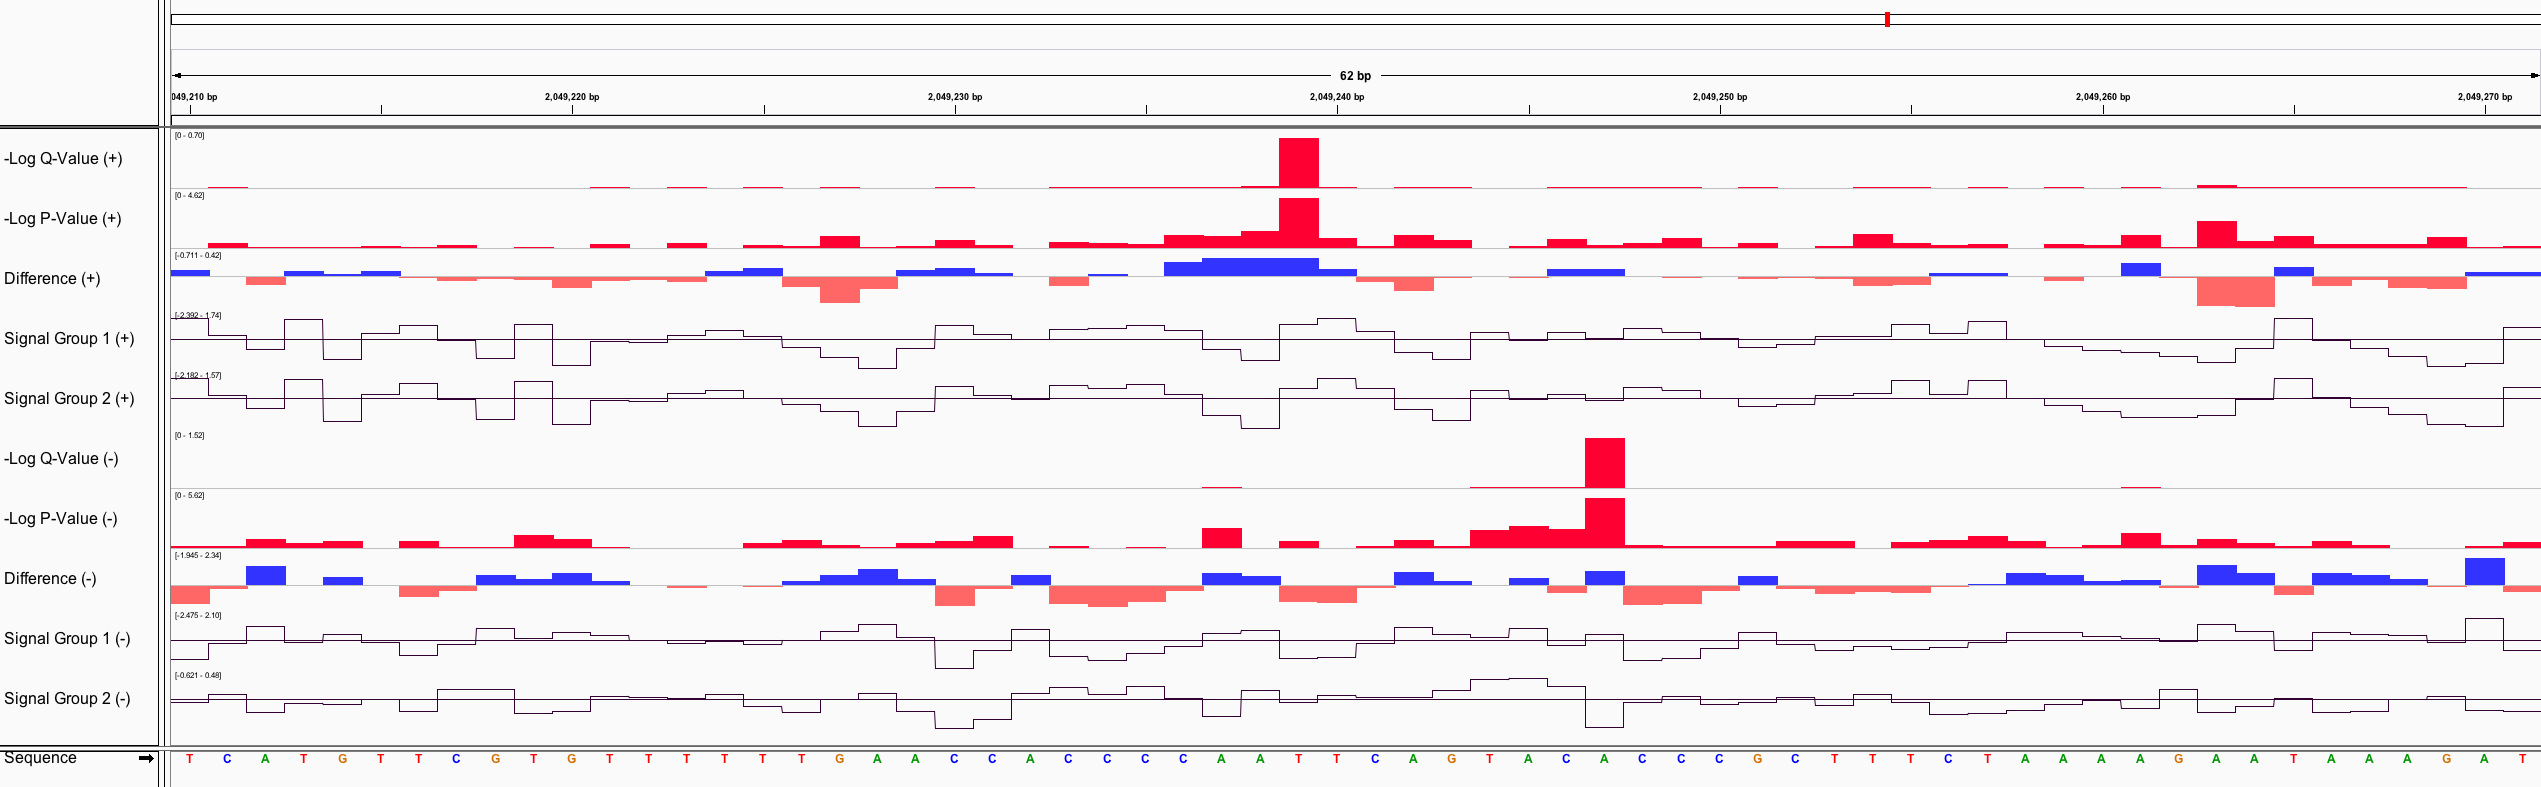
Example genome browser region with WIG files produced from nanoraw
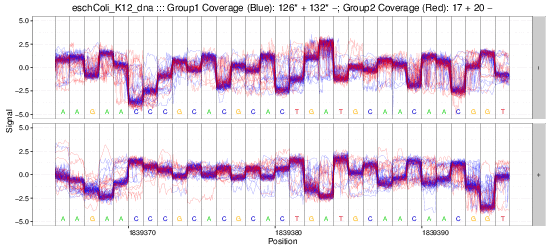
Example gif scrolling over genomic regions (note that this is not immediately produced by nanoraw, but does not take much more effort).
nanoraw Documentation