Genome Anchored Plotting Commands
Single Sample Plotting
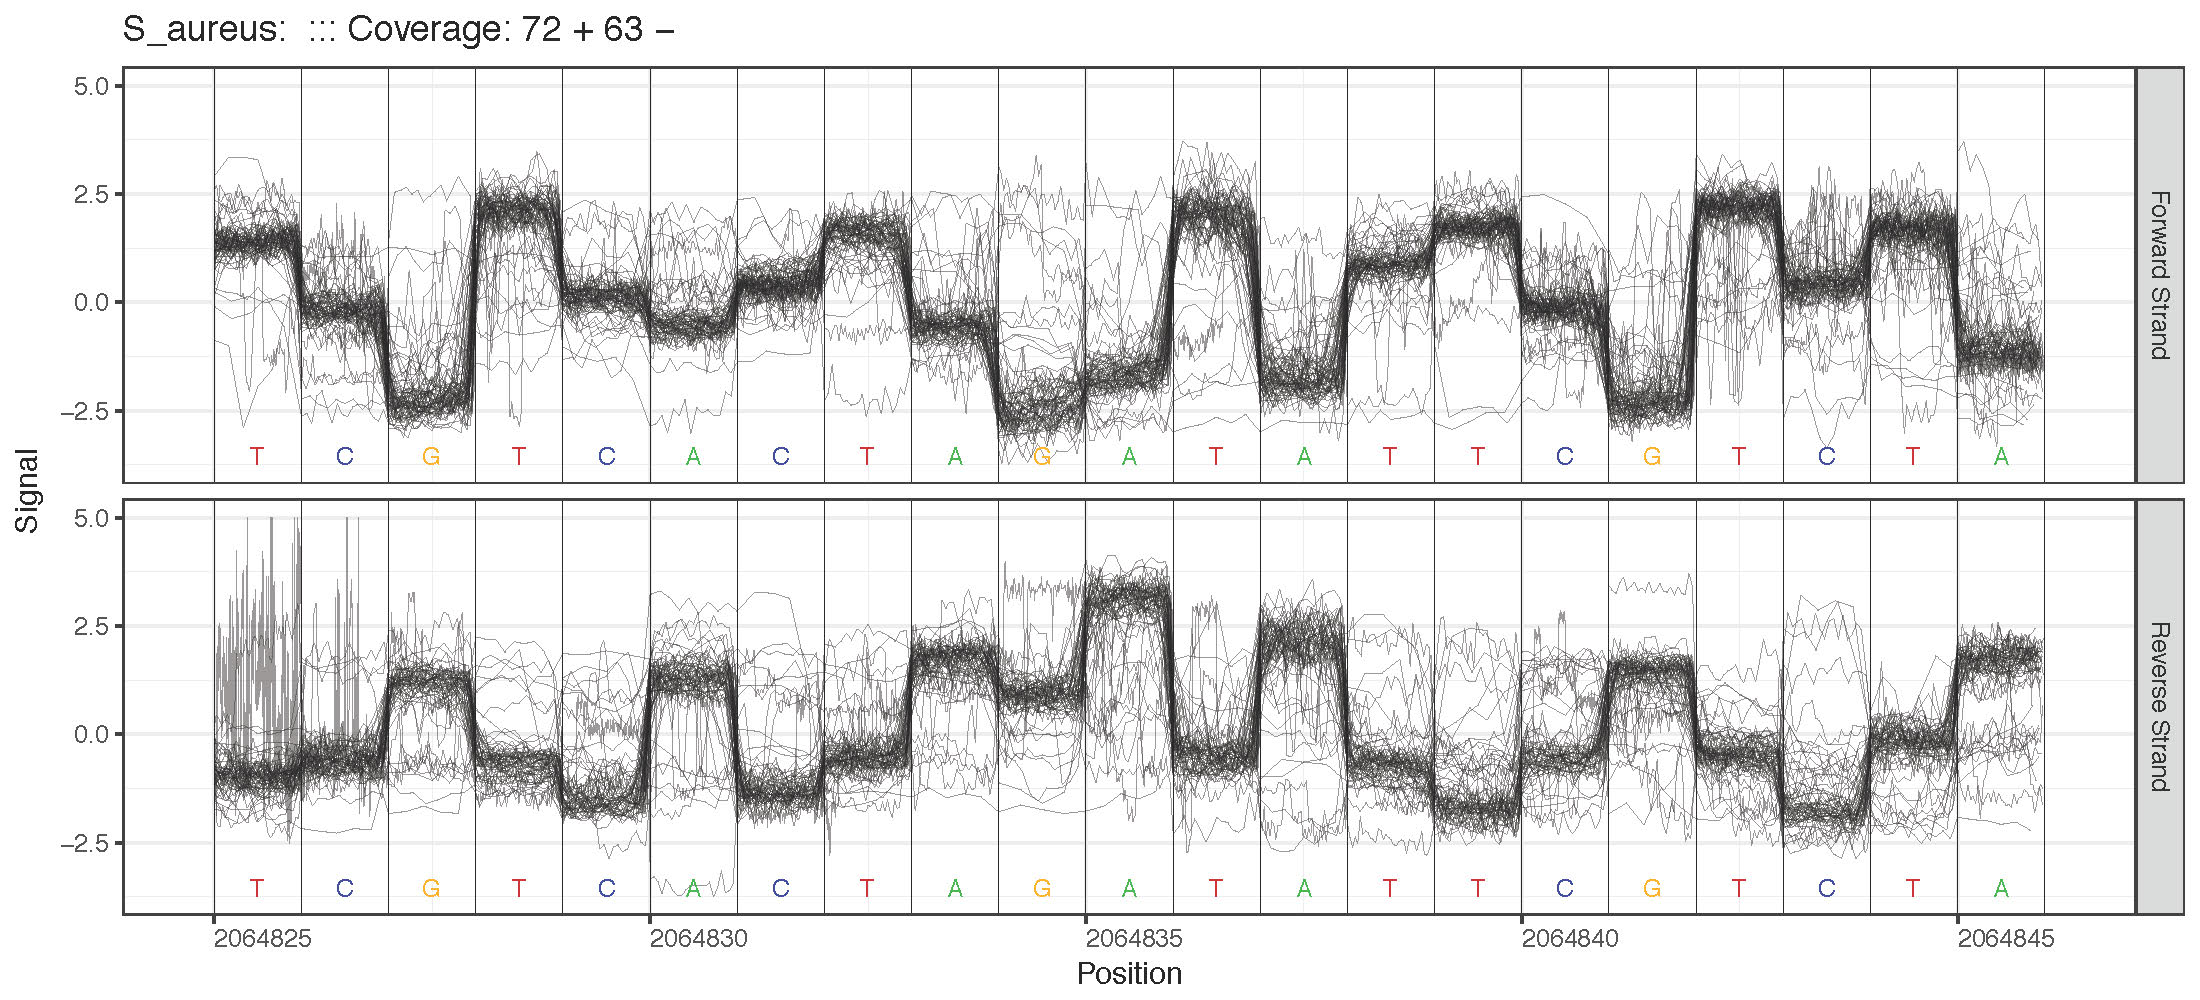
Single sample plotting example.
Region Plotting Selection Criterion
- Maximum coverage (plot_max_coverage)
- Specified Genome Locations (plot_genome_location)
- Centered on motif of interest (plot_motif_centered)
Two Sample Plotting
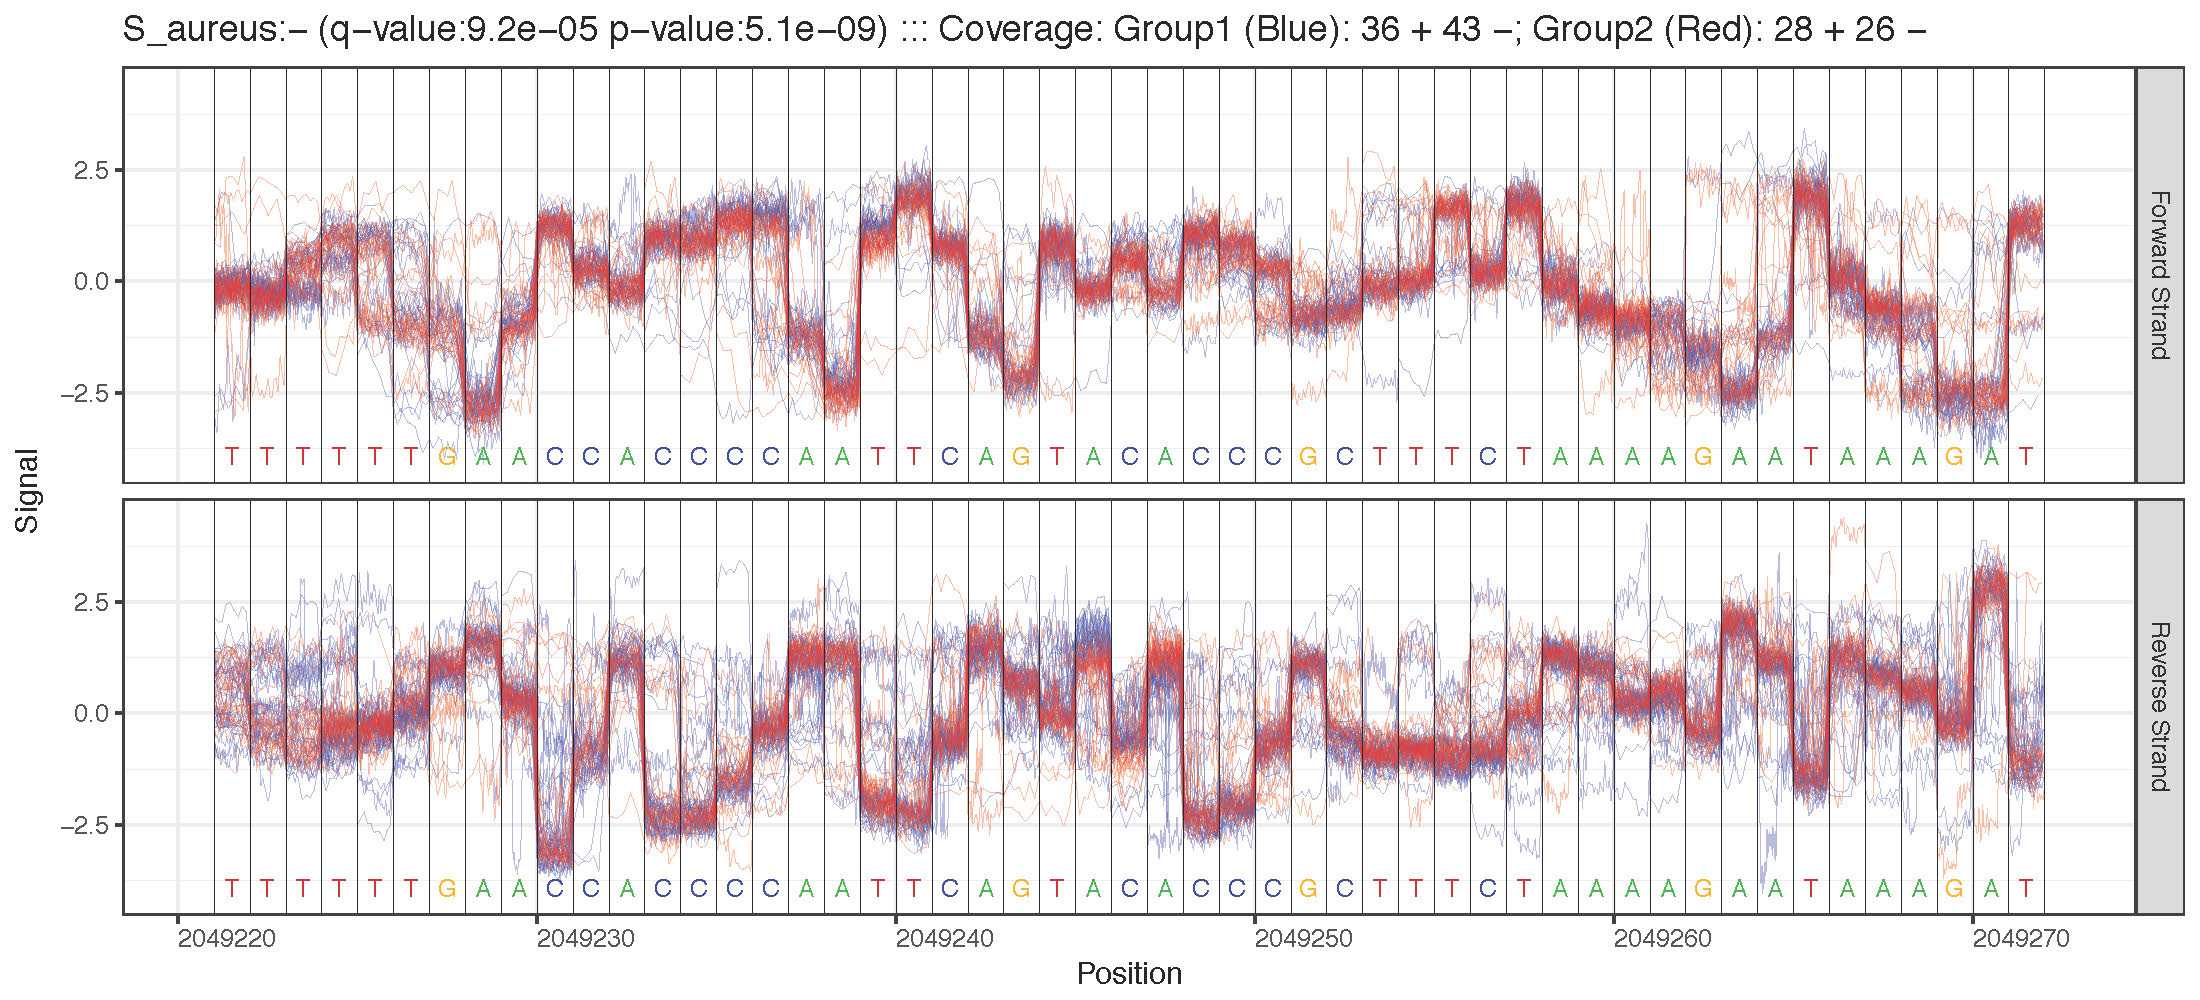
Two sample plotting example.
Region Plotting Selection Criterion
All those available from single sample plotting plus:
- Maximum difference in mean signal level between two samples (plot_max_difference)
- Most significant statistical test between two samples (plot_most_significant)
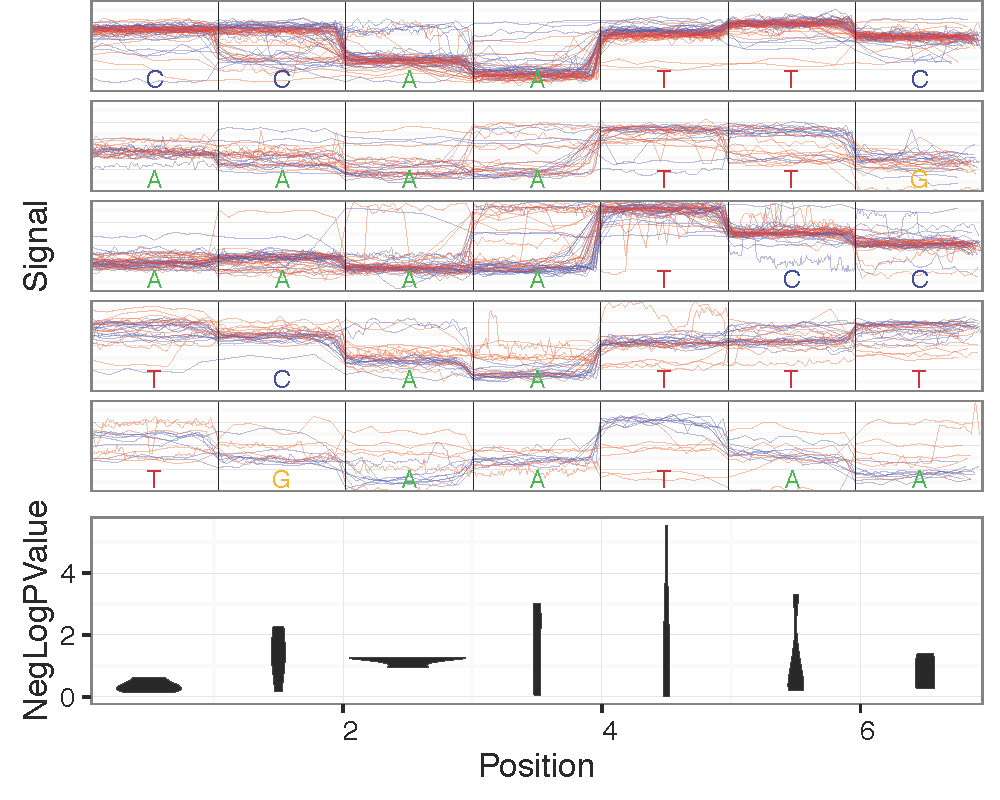
Motif Centered Multi-location with Statistics Plotting
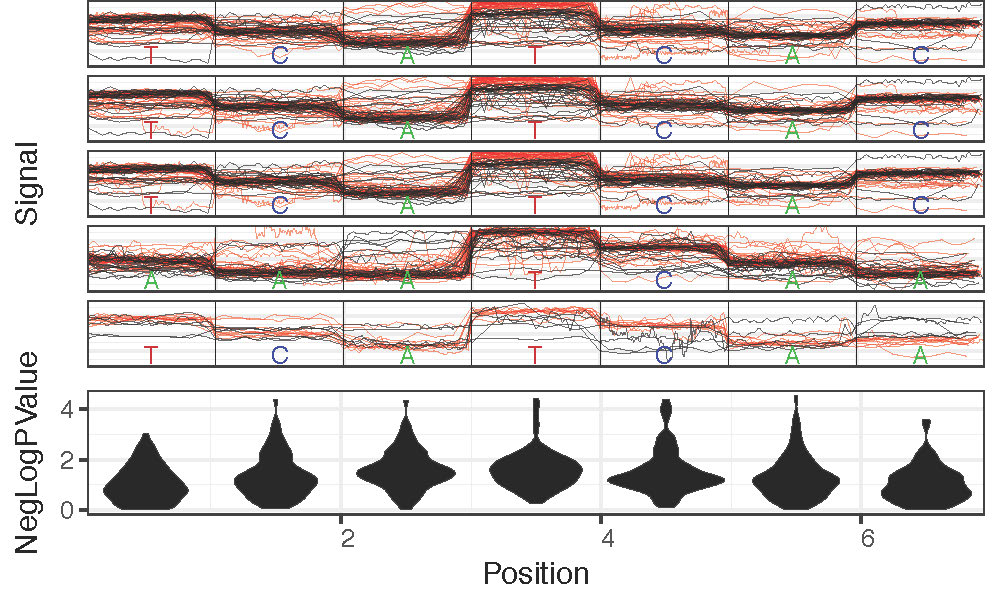
Motif centered plotting with distribution of statistical test surrounding motif.
Plot statistics distrbution around motif of interest across many genomic locations along with most significant example genomic regions with plot_motif_sith_stats.
Common Options
- –fast5-basedirs: One or more directories containing FAST5 files that have been “re-squiggled” (nanoraw genome_resquiggle). This option is required for all genomic plotting commands.
- –fast5-basedirs2: One or more directories containing FAST5 files that have been “re-squiggled” (nanoraw genome_resquiggle). These will be group2. This option is required only for plot_max_difference, plot_most_significant and plot_motif_with_stats
- –pdf-filename: Filename to store plots from this command. (Default depends on the command)
- –num-regions: Number of difference regions to plot. Each region will be on another page of the output PDF and ordered by criterion (if applicable). This option is not valid for plot_genome_location.
- –num-bases: Number of genomic bases to include in a plot. Selection criterion will apply to the central base of a plotted region.
- –obs-per-base-filter: Filter reads for plotting baseed on threshold of percentiles (over all bases in a read) of the number of observations assigned to a base. Format thresholds as “percentile:thresh [pctl2:thresh2 …]” E.g. reads with 99th pctl <200 obs and max <5k obs would be “99:200 100:5000”. Default is no filter.
Overplotting Options
- –overplot-threshold: Number of reads to trigger alternative plot type instead of raw signal due to overplotting. Default depends on command.
- –overplot-type: Plot type for regions with higher coverage. Choices: Downsample (default), Boxplot , Quantile, Violin. Examples below.
Downsample Overplotting example
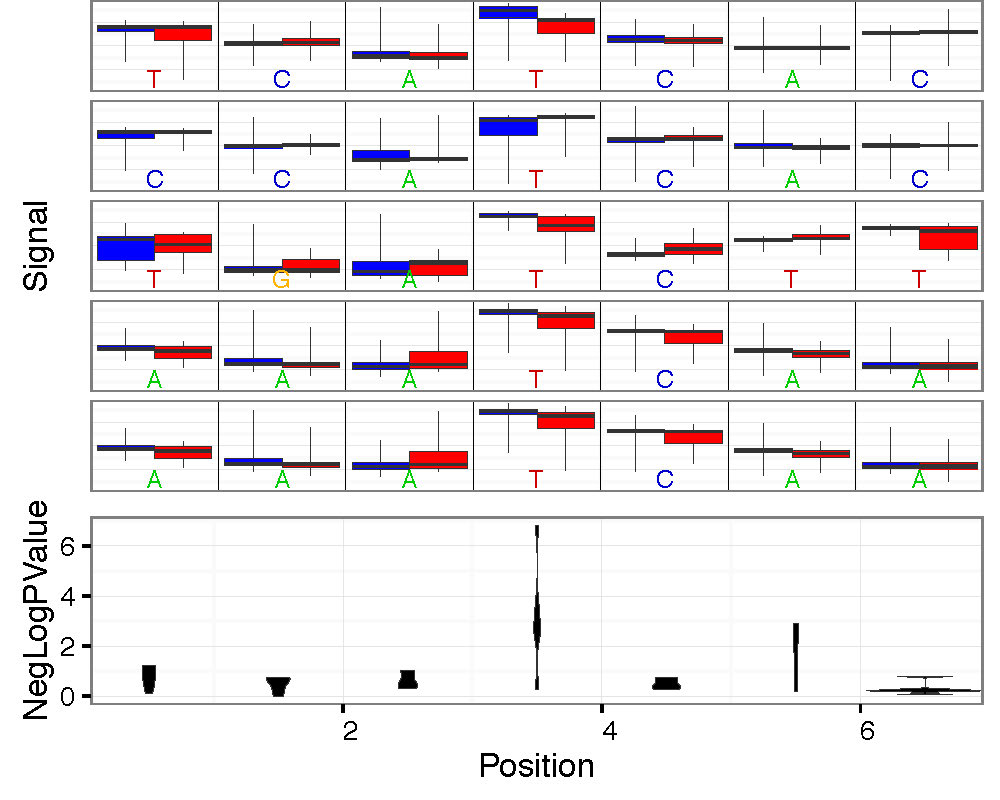
Boxplot Overplotting example
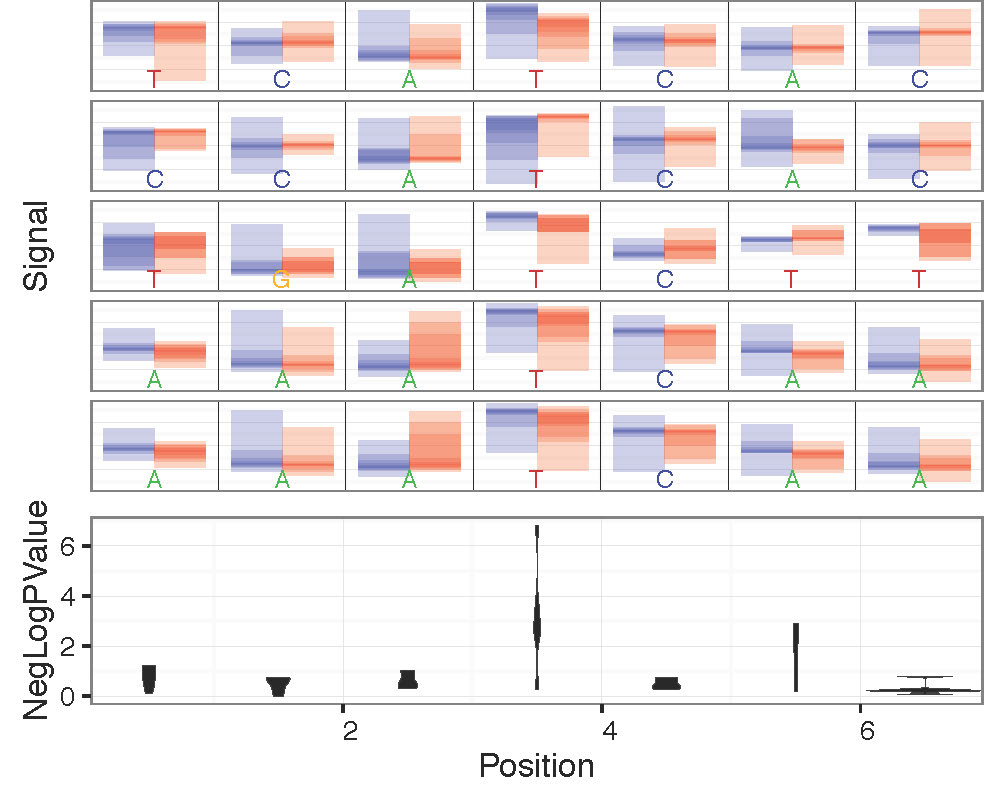
Quantile Overplotting example
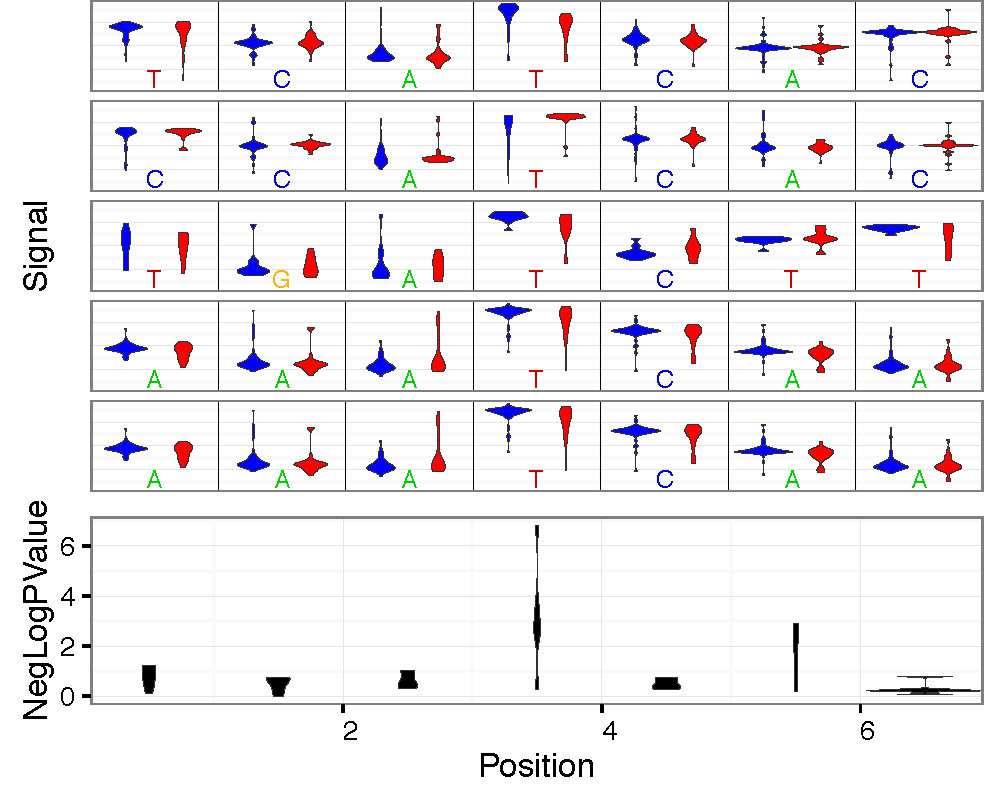
Violin Overplotting example
Data Slot Options
- –corrected-group: FAST5 group to access/plot created by genome_resquiggle script. Default: RawGenomeCorrected_000. The default is the default slot used by the genome_resquiggle command so this command will not need to be set unless you would like to access an alternatively re-squiggled slot (e.g. including multiple signal normalizations within the same file).
- –basecall-subgroups: FAST5 subgroup (under Analyses/[corrected-group]) where individual template and/or complement reads are stored. Default: BaseCalled_template. This is the default supplied by ONT and should work for most cases.
- –2d: Input contains 2D reads and both forward and complement should be plotted. Equivalent to –basecall-subgroups BaseCalled_template BaseCalled_complement
Command Specific Options
plot_genome_location Option
- –genome-locations: Plot signal at specified genomic locations. Regions will be centered on the specified genomic position. Format locations as “chrm:position [chrm2:position2 …]”. E.g. “chr1:1000 chr21:40000 chrY:5000”
plot_motif_centered and plot_motif_with_stats Options
- –motif: DNA motif of interest. Can be composed of any one letter DNA codes (NEB Single Letter Codes).
- –genome-fasta: FASTA file used to map reads with genome_resquiggle command. If chromosomes are missing then regions from those chromosomes (or organims if multi-species) will not be considered for plotting.
plot_most_significant and plot_motif_with_stats Options
- –test-type: Type of significance test to apply. Choices are: mw_utest (default; mann-whitney u-test), ttest.
- –fishers-method-offset: Offset up and downstream over which to compute combined p-values using Fisher’s method. For example 2 would compute the Fisher’s method p-value over a moving window of 5 bases. Default: Do not compute Fihser’s method p-values (report raw, base-by-base p-values).
- –statistics-filename: Filename to save/load base by base signal difference statistics. If file exists it will be loaded, if it does not exist it will be created to save statistics. Default: Don’t save/load. Note that –test-type and –fishers-method-offset will be ignored if –statistics-filename is provided and the file exists.
- –minimum-test-reads: Number of reads required from both samples to test for significant difference in signal level. Note that regions with lower coverage levels will not have p-values be computed. Default: 5
plot_most_significant Options
- –q-value-threshold: Choose the number of regions to plot by the FDR corrected p-values. Note that –num-regions will be ignored if this option is set.
- –sequences-filename: Filename to store genomic sequences at selected regions (e.g. for PWM search). Sequences will be stored in FASTA format. Default: None.
plot_motif_with_stats Option
- –num-context: Number of bases to plot surrounding motif of interest. Default: 2
Example commands
Single sample genome-anchored plotting functions:
nanoraw plot_max_coverage --fast5-basedirs $g1Dir --2d \
  --num-bases 21 --overplot-threshold 1000
nanoraw plot_max_coverage --fast5-basedirs $g1Dir --2d \
  --num-bases 21 --overplot-threshold 1000 \
  --obs-per-base-filter 99:200 100:5000
nanoraw plot_genome_location --fast5-basedirs $g1Dir \
  --genome-locations "S_aureus:2064835" "S_aureus:2064935" \
  --2d --num-bases 21 --overplot-threshold 1000
nanoraw plot_motif_centered --fast5-basedirs $g1Dir --motif AHC \
  --genome-fasta $genomeFn --2d \
  --num-bases 21 --overplot-threshold 1000
nanoraw plot_motif_centered --fast5-basedirs $g1Dir --motif AHC \
  --genome-fasta $genomeFn --2d \
  --num-bases 21 --overplot-threshold 1000 --deepest-coverage
Mutliple sample genome-anchored plotting functions:
nanoraw plot_max_coverage --fast5-basedirs $g1Dir \
  --fast5-basedirs2 $g2Dir --2d \
  --num-bases 21 --overplot-threshold 1000
nanoraw plot_max_coverage --fast5-basedirs $g1Dir \
  --fast5-basedirs2 $g2Dir --2d \
  --num-bases 21 --overplot-threshold 1000 \
  --obs-per-base-filter 99:200 100:5000
nanoraw plot_genome_location --fast5-basedirs $g1Dir \
  --fast5-basedirs2 $g2Dir \
  --genome-locations "S_aureus:2064835" "S_aureus:2064935" \
  --2d --num-bases 21 --overplot-threshold 1000
nanoraw plot_motif_centered --fast5-basedirs $g1Dir --motif AHC \
  --genome-fasta $genomeFn \
  --fast5-basedirs2 $g2Dir --2d \
  --num-bases 21 --overplot-threshold 1000 --deepest-coverage
Mutliple sample statistical testing genome-anchored plotting functions:
nanoraw plot_max_difference --fast5-basedirs $g1Dir \
  --fast5-basedirs2 $g2Dir --2d \
  --num-bases 21 --overplot-threshold 1000
nanoraw plot_most_significant --fast5-basedirs $g1Dir \
  --fast5-basedirs2 $g2Dir --2d \
  --num-bases 21 --overplot-threshold 1000
nanoraw plot_motif_with_stats --fast5-basedirs $g1Dir \
  --fast5-basedirs2 $g2Dir --motif AHC --2d \
  --overplot-threshold 1000 --test-type mw_utest \
  --genome-fasta $genomeFn
Overplotting options:
nanoraw plot_max_coverage --fast5-basedirs $g1Dir \
  --fast5-basedirs2 $g2Dir --2d \
  --num-bases 21 --overplot-threshold 20 --overplot-type Downsample \
  --pdf-filename Nanopore_read_coverage.max_coverage.Downsample.pdf
nanoraw plot_max_coverage --fast5-basedirs $g1Dir \
  --fast5-basedirs2 $g2Dir --2d \
  --num-bases 21 --overplot-threshold 20 --overplot-type Boxplot \
  --pdf-filename Nanopore_read_coverage.max_coverage.Boxplot.pdf
nanoraw plot_max_coverage --fast5-basedirs $g1Dir \
  --fast5-basedirs2 $g2Dir --2d \
  --num-bases 21 --overplot-threshold 20 --overplot-type Quantile \
  --pdf-filename Nanopore_read_coverage.max_coverage.Quantile.pdf
nanoraw plot_max_coverage --fast5-basedirs $g1Dir \
  --fast5-basedirs2 $g2Dir --2d \
  --num-bases 21 --overplot-threshold 20 --overplot-type Violin \
  --pdf-filename Nanopore_read_coverage.max_coverage.Violin.pdf